The 12-month forecast
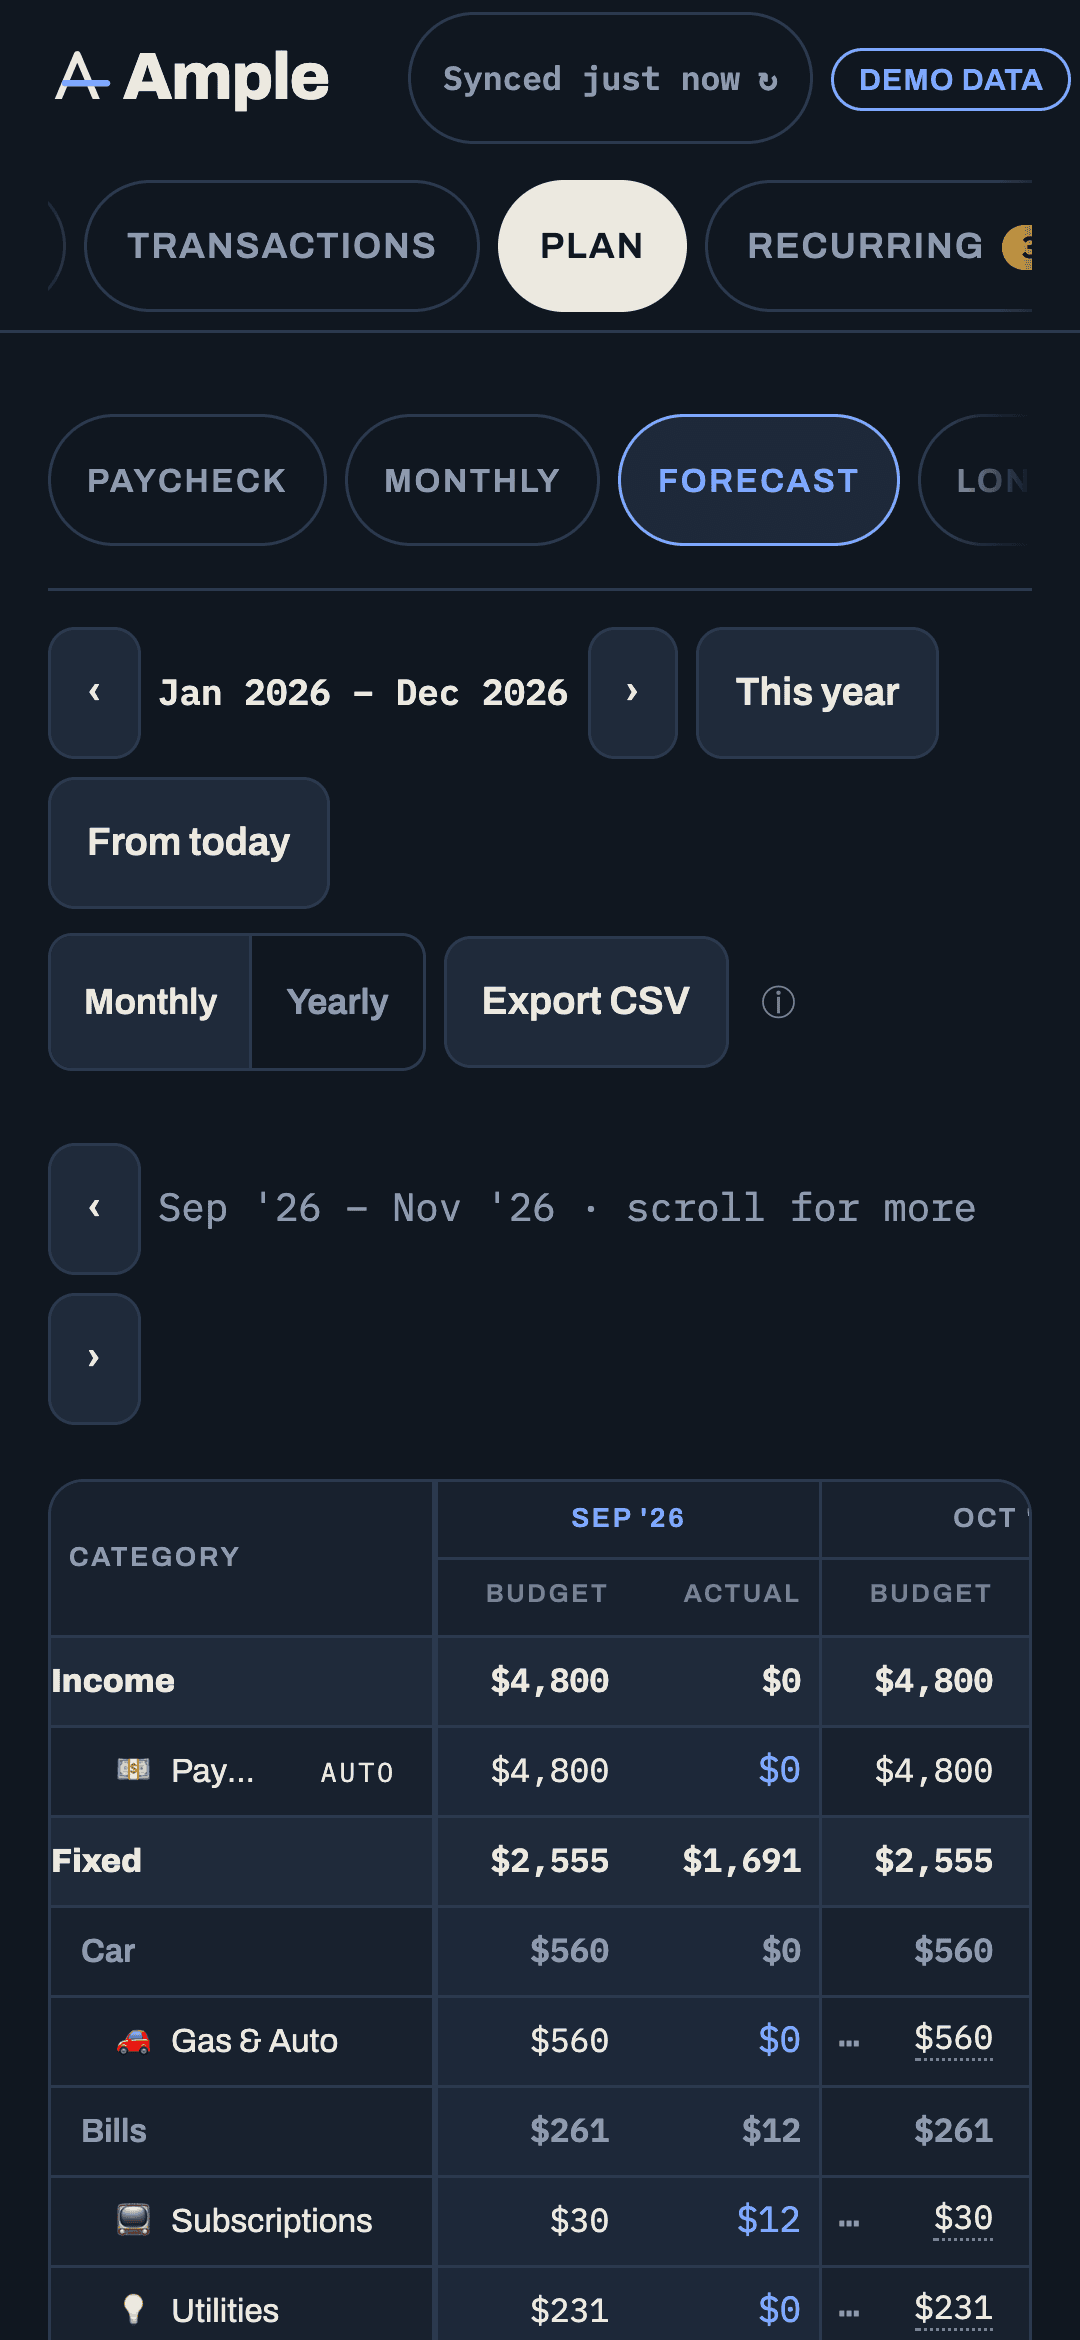
Plan › Forecast shows every category across twelve months with budget and actual side by side, editable future cells, 3-paycheck months and mortgage halves filled in, and a CSV export.
Updated September 5, 2026 · 2 min read
The forecast grid is the same budget you edit month by month, laid out twelve months wide. Same categories, same data, one view instead of twelve.
Reading the grid
Rows are the buckets, groups and categories from Budgets. Columns are months, each with Budget | Actual. Actuals fill past and the current month; future months show "–". The first column and the header stay put while you scroll. Each bucket and group has a subtotal row, and at the bottom Total expenses and Total left (income minus expenses and savings; negatives in red).
Pinned right: To date budget and actual, and a Remaining planned total for the months still to come.
What fills itself in
- Income: paydays in the month × net pay, with a 3 paychecks chip where it applies.
- Mortgage halves and any paycheck-deducted bill: halves × paydays, tagged auto.
- Non-monthly categories: the accrual each month, a draw chip in the due month, then the restarted accrual.
- Goal contributions under Savings & goals, owned by the goal.
Editing
Future budget cells are editable: tap, type, Tab to move to the next cell, Esc to cancel. An edit in the grid is a this-month-only value; edits on the Budgets page carry forward. The cell's ⋯ menu offers:
- Apply to remaining months — copy this value to every later month in the window.
- Copy from previous year — take the same month last year.
- Increase remaining months by N% — for a raise, or inflation.
Past actuals over budget read red; hover for the variance; tap to open the transactions behind the cell.
Window and views
‹ › shift the window a year. This year starts at January; From today starts at the current month. Monthly / Yearly toggles to one locked column per calendar year, each the sum of its months.
Mobile
A three-month window with swipe and ‹ › buttons, the category column stuck to the left, tap to edit.
CSV
Export CSV writes one line per grid row with 24 month columns (budget and actual), the to-date figures and the remaining total. Useful for a spreadsheet, or for handing a year to someone else.
Forecast and Long-range
The forecast is month-by-month for the next year. Long-range takes it year by year to the end of your plan, with life events and scenarios. They share the same assumptions store. See Long-range forecasting and scenarios.
More in Plan
Still stuck?
Tell us what you were trying to do and what happened. A person reads every message.
Contact support